Record Temperature, Humidity and Pressure with an ESP32, a Bosh BME280 sensor and InfluxDB
Install InfluxDB and Grafana at your server and create a database
-
On Debian-based systems the installation of InfluxDB is straigt forward:
apt install influxdb influxdb-clientAfterwards a new database (with name
sensors) can be setup by connecting to InfluxDB with theinfluxcommand and then running theCREATE DATABASE sensors. -
Grafana should be installed based on the instructions on the Grafana Web Site.
Connect the Bosh BME280 sensor to the ESP32
- I prefer using an RJ45 cable for the connection with the following pin layout which minimizes interference:
- VIN: White-Orange
- GND: Brown
- SCL: White-Brown
- SDA: Orange
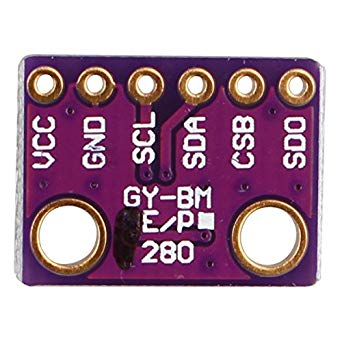
- Optional: Change the BME280’s I2C bus address: If you plan to use two sensors at once, you need to ensure that they have different I2C bus addresses.
- The default bus address is 0x76.
- If your breakout board has an SDO pin, you can change the bus address to 0x77 by connecting the SDO bin to GND.

-
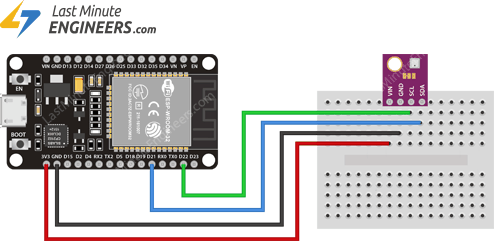
The sensor is then connected to the ESP32 as outlined in the picture below:

Upload humidity-probe-influxdb to the ESP32
Download the humidity-probe-influxdb project from github and update custom.h-example to reflect your WiFi setup and InfluxDB URL. Once you transfer the Sketch to your ESP32 the ESP32 will
- read temperature, humidity and pressure and
- transfer the measurements to your InfluxDB server, once ten measurements have been collected. (The first transfer of measurements will start approximately after ten minutes)
Log into Grafana and configure your dashboards
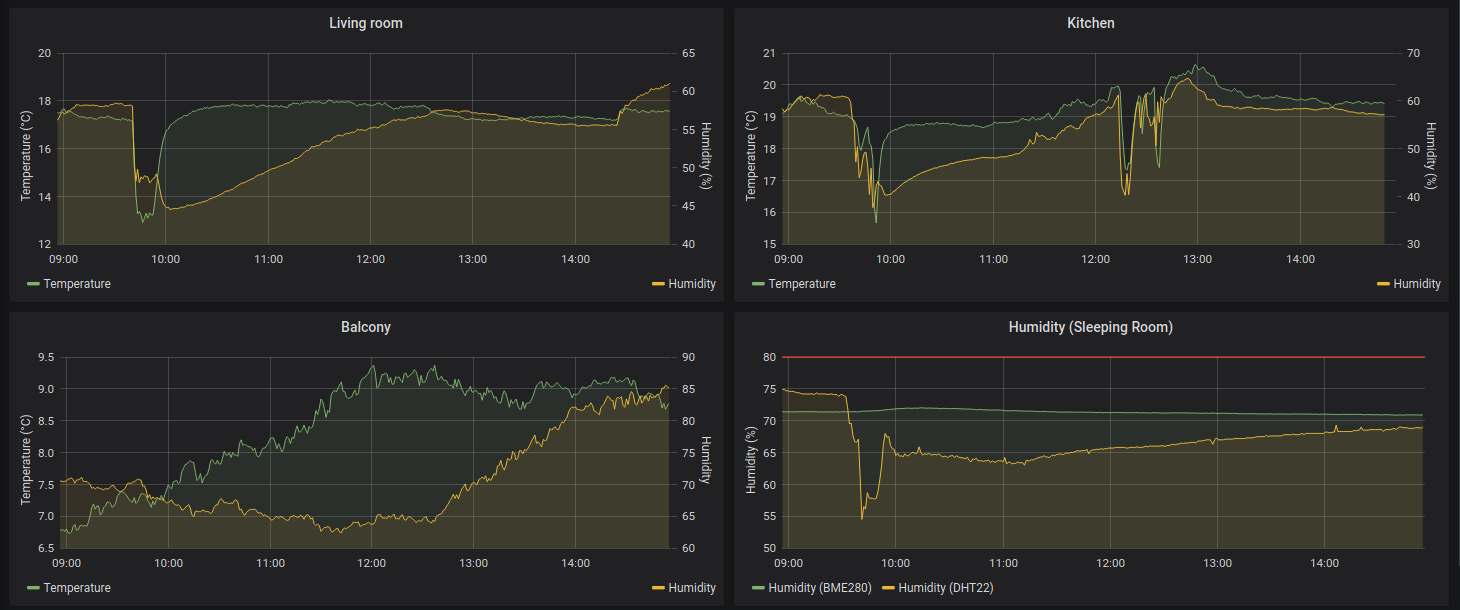
Per default Grafana listens on port 3000 and should be available at http://your-grafana-server-ip:3000. You can log into Grafana to setup queries, graphs and dashboards as illustrated in the example below.


Leave a comment